Patient-Reported Outcomes in the PROTECT Clinical Trial Comparing Sparsentan With Irbesartan for Immunoglobulin A Nephropathy
2024
Background

To determine the estimated glomerular filtration rate (eGFR) trajectories of patients who achieved complete remission (CR) of proteinuria (<0.3 g/d) or urinary protein excretion (UPE) <0.5 g/d at any time during the 110-week PROTECT trial
versus those who did not1
This treatment agnostic analysis will determine whether these levels of proteinuria reduction were associated with
favorable outcomes1
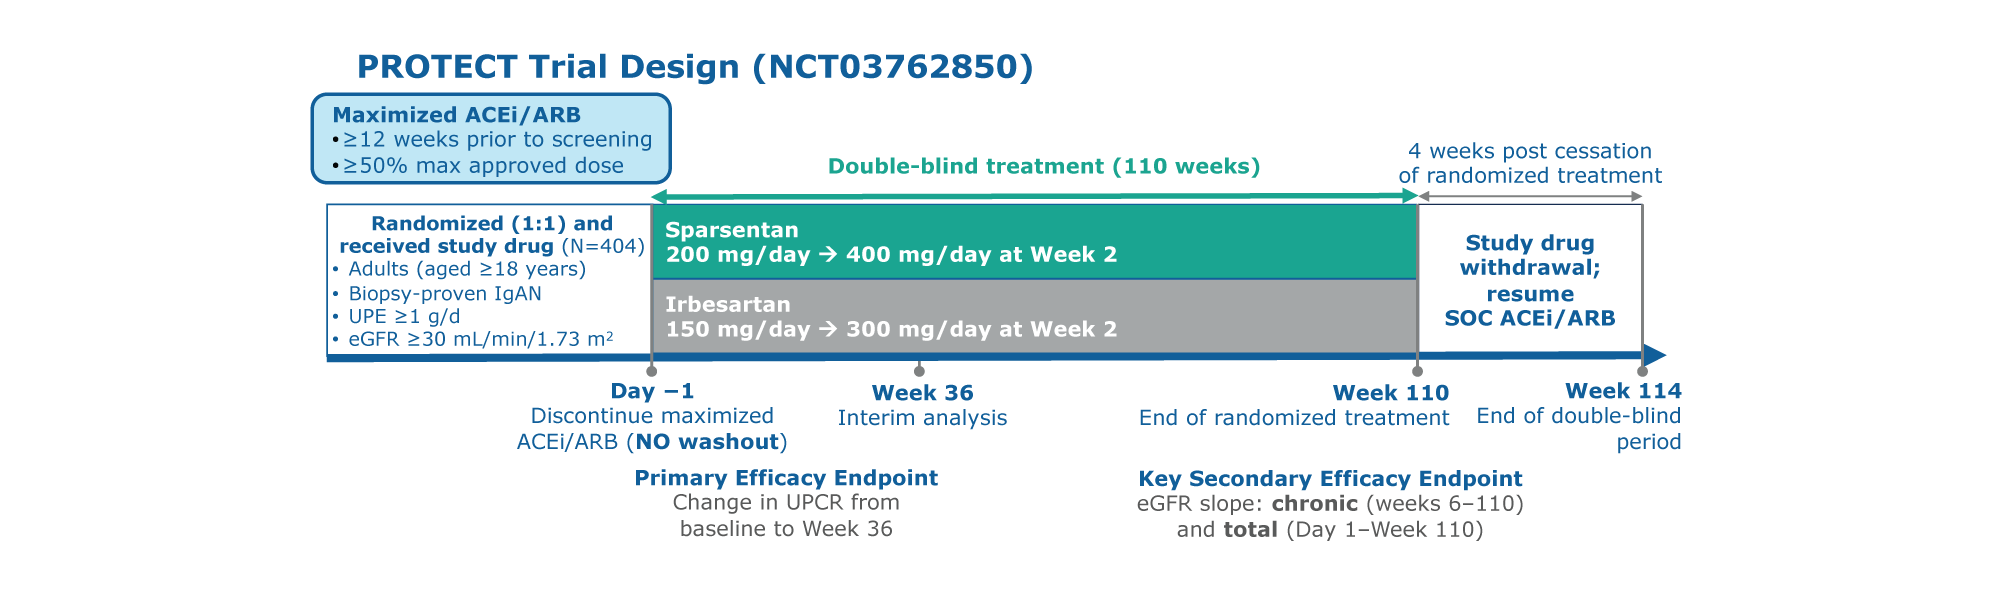
Figure. PROTECT study design
PROTECT is a large, international, randomized, double-blind, active-controlled Phase 3 trial to assess the efficacy and safety
of sparsentan versus irbesartan1
Participants were randomly assigned to the treatment, sparsentan or active-controlled, maximum labeled dose irbesartan group1
Study included a 110-week double-blind treatment period and 4 weeks of study drug withdrawal. Interim analysis occurred at 36 weeks. Two-year follow-up occurred at 110 weeks1
Patients who achieved proteinuria remission had similar demographics compared to those who did not except baseline UPE was lower and baseline eGFR was higher in patients who achieved remission1
Overall, 21.0% (85/404) and 37.4% (151/404) of patients achieved CR and UPE <0.5 g/d, respectively1
Achieving CR and UPE <0.5 g/d was more common among patients receiving sparsentan than maximum labeled
dose irbesartan1
The majority of patients who achieved proteinuria remission had been randomized to the sparsentan group, and the majority who did not had been randomized to the maximum labeled dose irbesartan group1
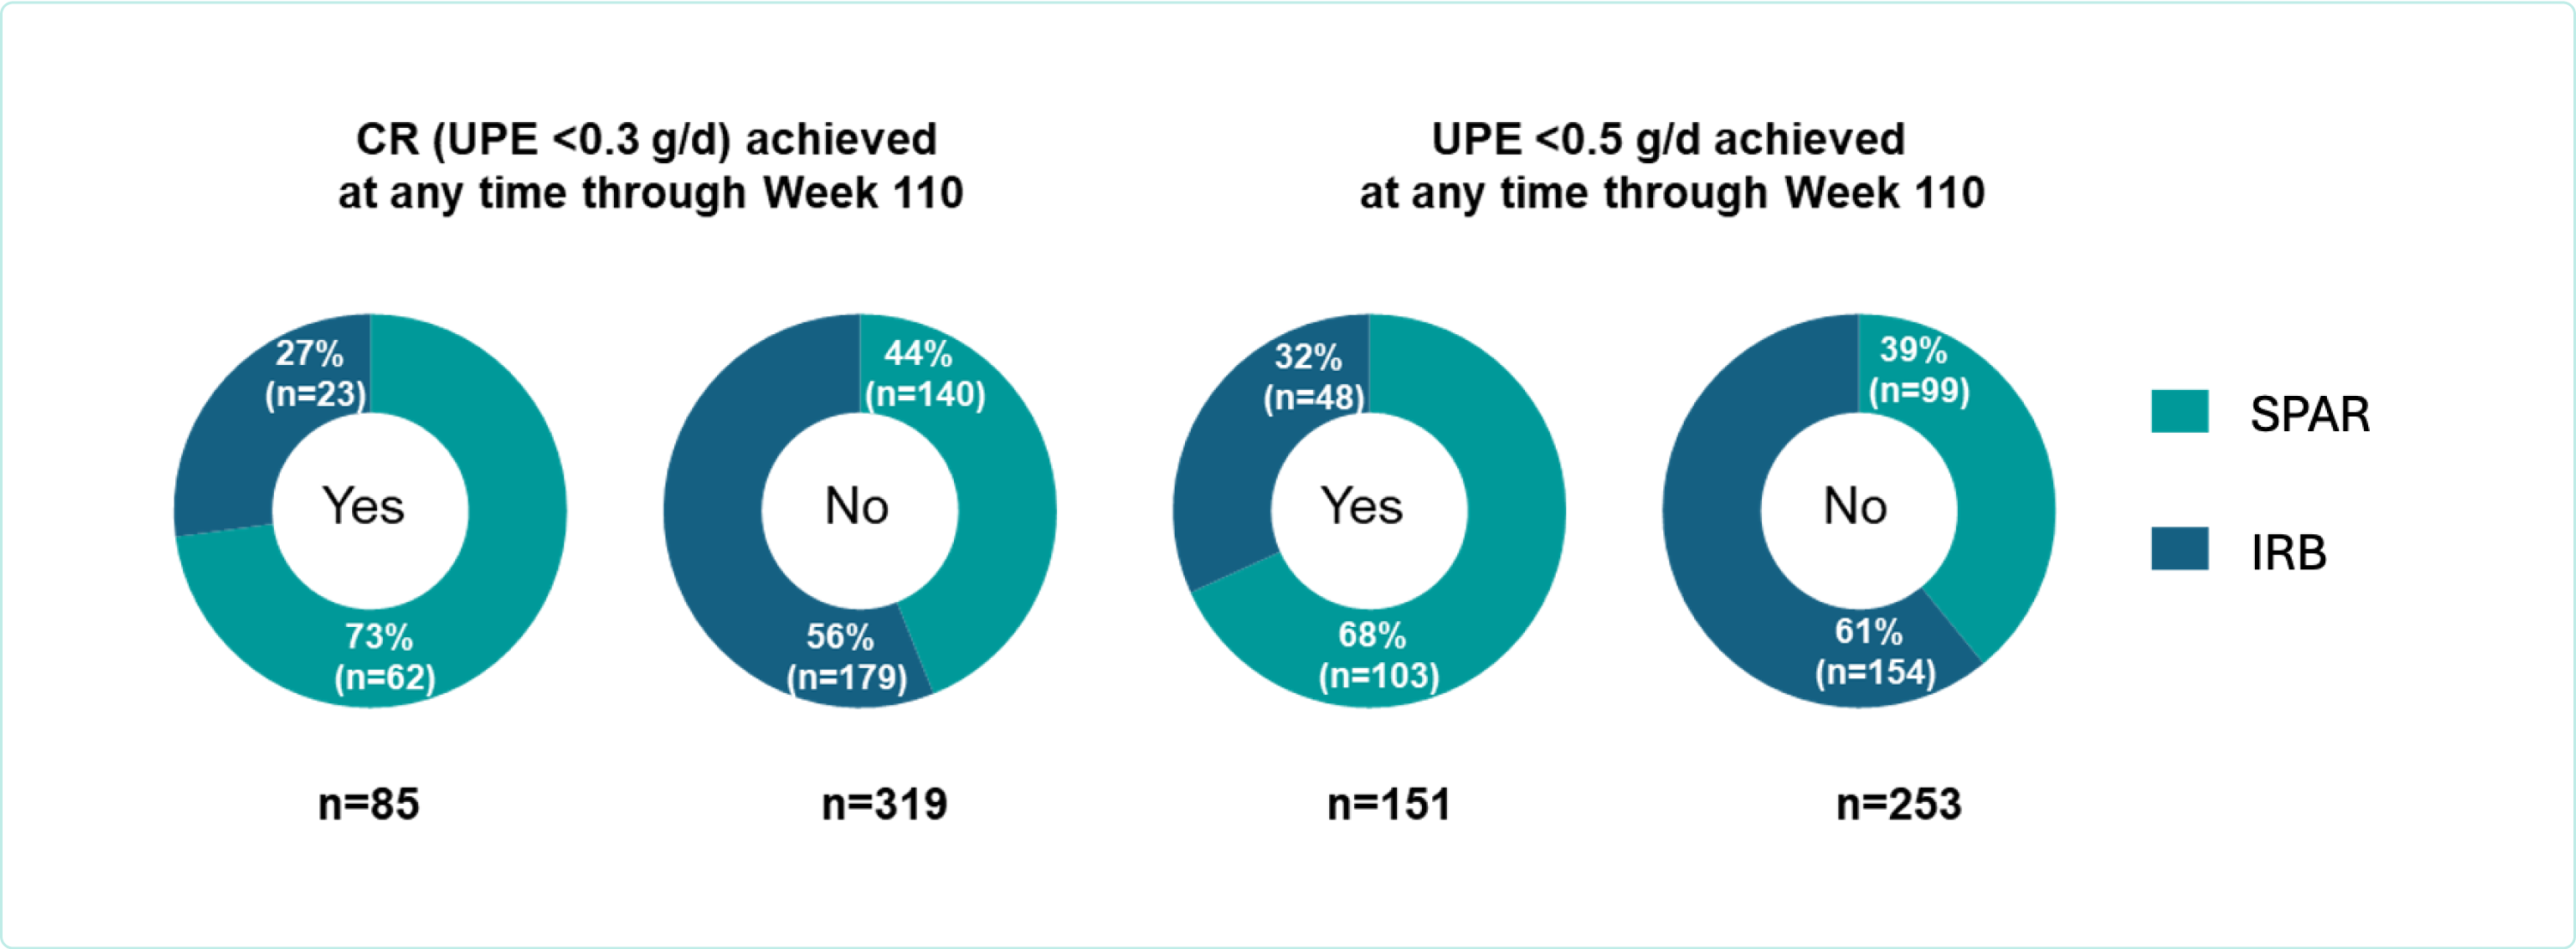
Figure. Patients achieving CR or UPE <0.5 g/d by treatment assignment at any time from baseline through Week 110
Patients were three times more likely to achieve CR with sparsentan compared to maximum labeled dose irbesartan (73% [62/85] verus 27% [23/85])1
UPE <0.5g/d was achieved in 68% (103/151) of patients with sparsentan versus 32% (48/151) with irbesartan1
eGFR preservation was more evident in patients who achieved CR or UPE <0.5 g/d versus those who did not1
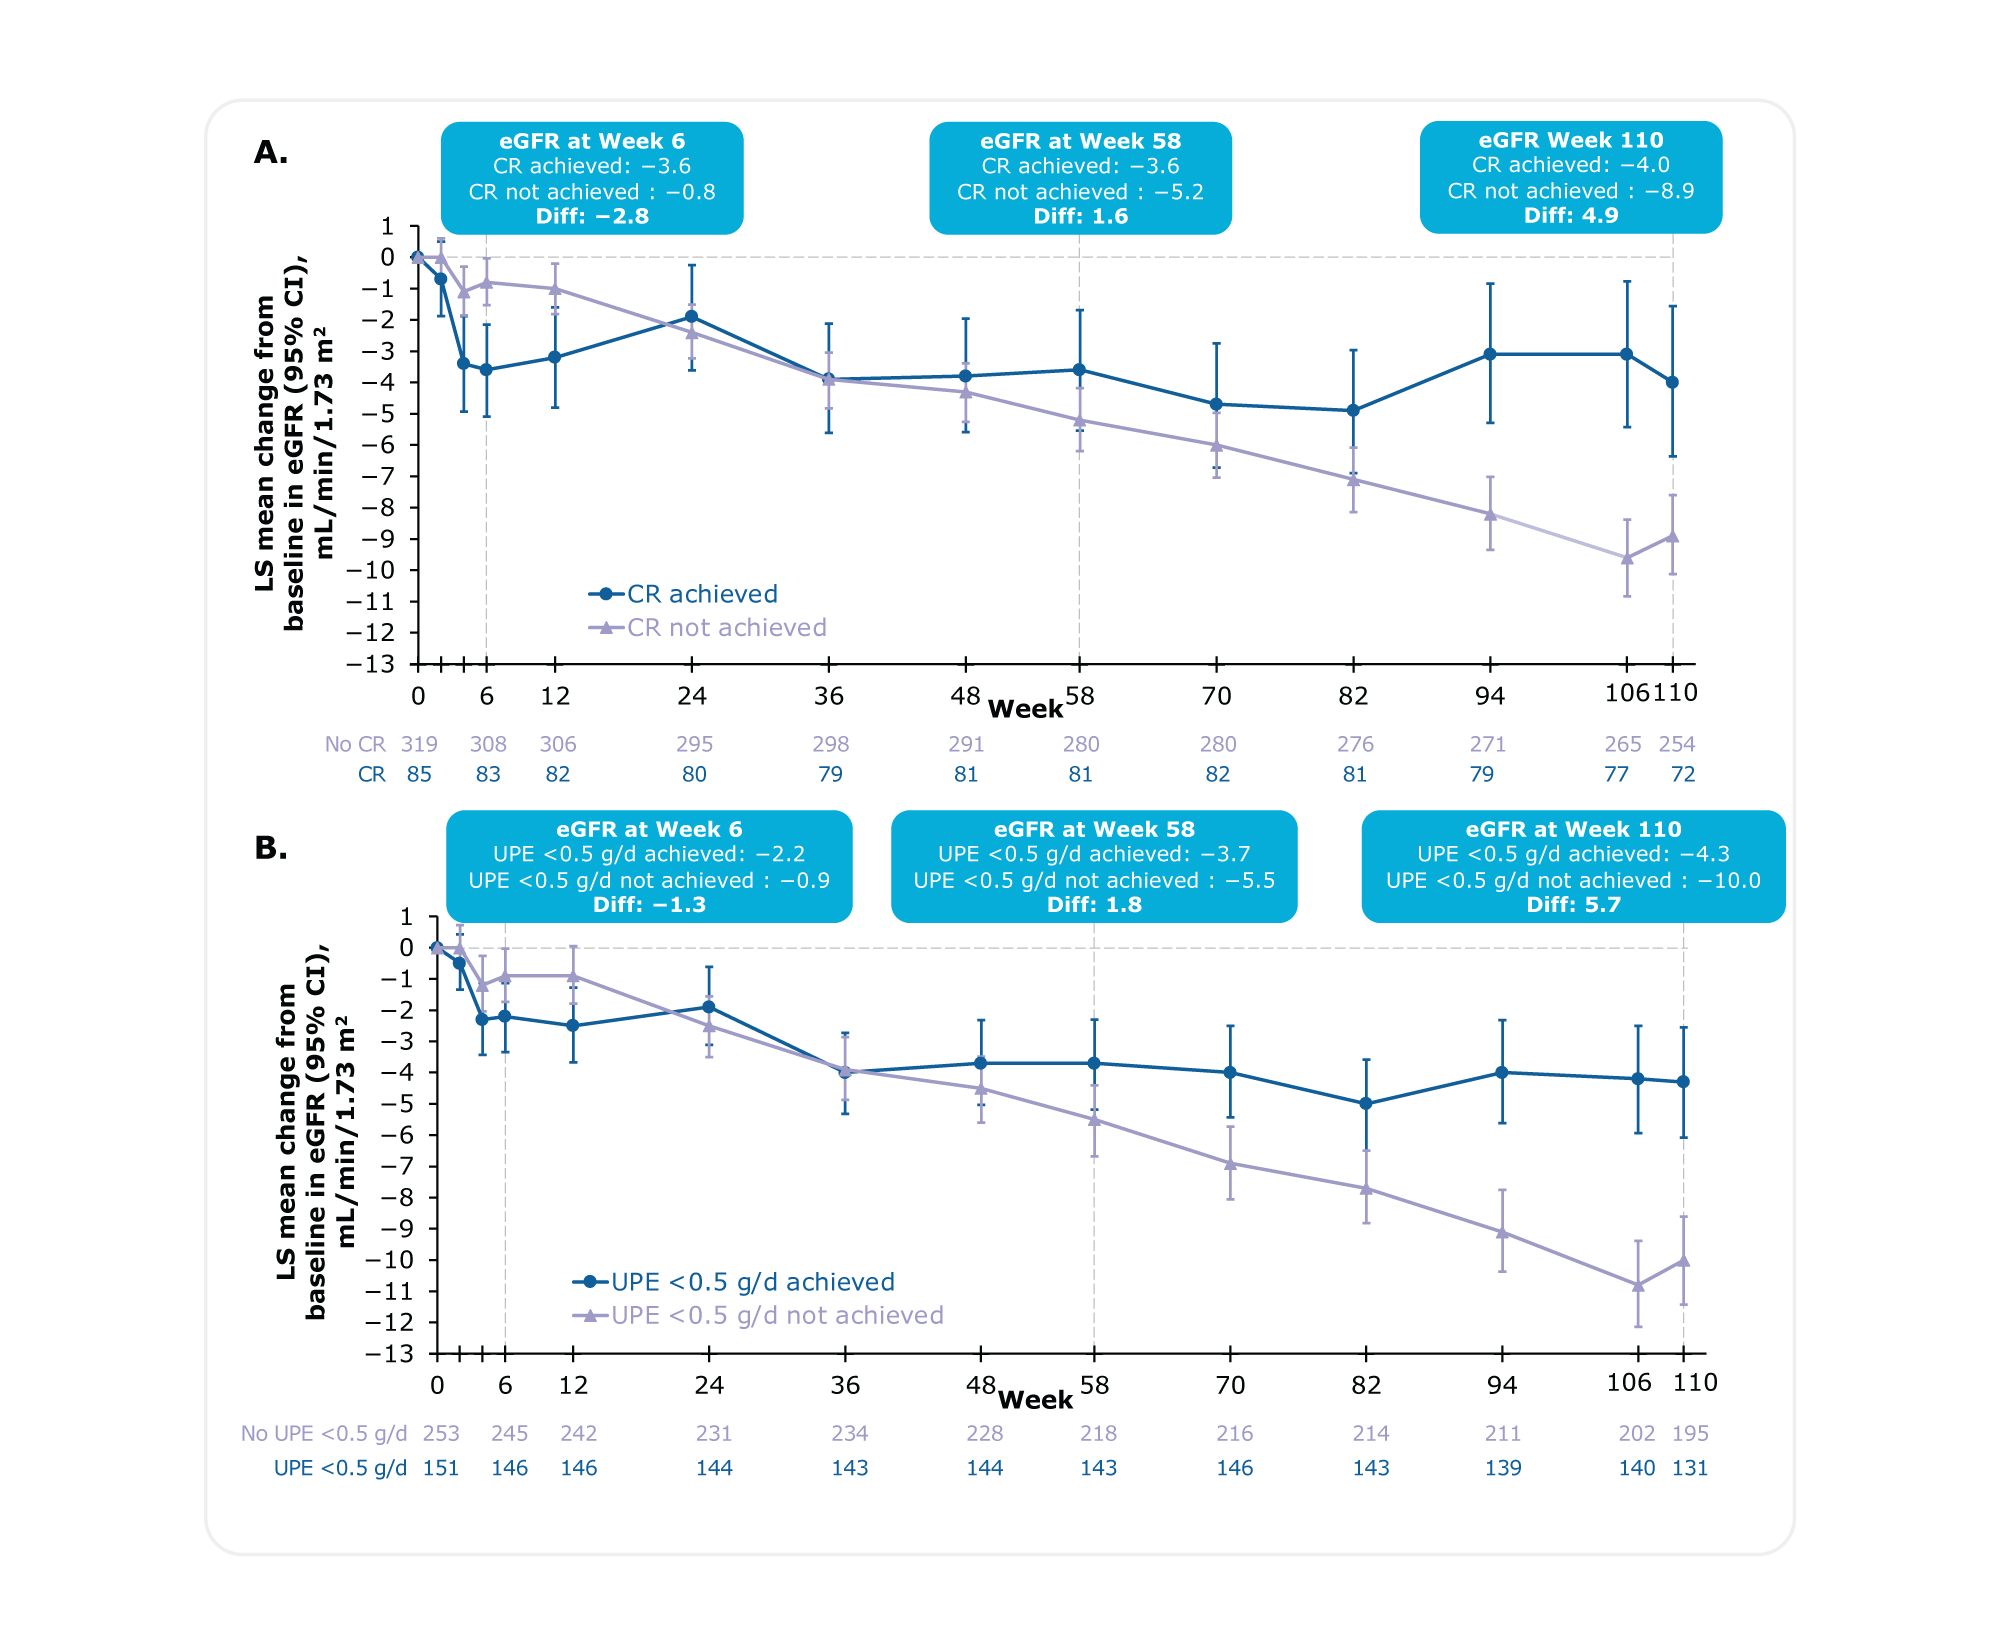
Figure. Absolute change from baseline in eGFR at each study visit in patients who achieved A) CR or B) UPE <0.5 g/daya
At any time through Week 110, in patients who achieved CR or UPE <0.5 g/day, eGFR acutely dropped in the first few weeks but stabilized through Week 1101
In patients who never achieved CR or UPE <0.5 g/d, eGFR showed a smaller acute drop after which it steadily declined through Week 1101
aChange from baseline in eGFR by visit using a mixed model for repeated measures (MMRM) with on-study values and baseline UPE adjustment.1
At 2 years (Week 110), patients achieving CR experienced a slower kidney function decline than those who did not (-4.0 versus -8.9, Difference: 4.9)1
At 2 years (Week 110), patients achieving UPE <0.5 g/day experienced a slower kidney function decline than those who did not (-4.3 versus -10.0, Difference: 5.7)1
The rate of eGFR decline, represented by the chronic and total eGFR slopes,* was slower in patients who achieved CR or UPE <0.5 g/d versus those who did not1
Notably, in patients who achieved CR at any time through Week 110, the mean rate of kidney function decline
(eGFR chronic slope) was below the therapeutic goal of <1.0 mL/min/1.73 m2 per year1
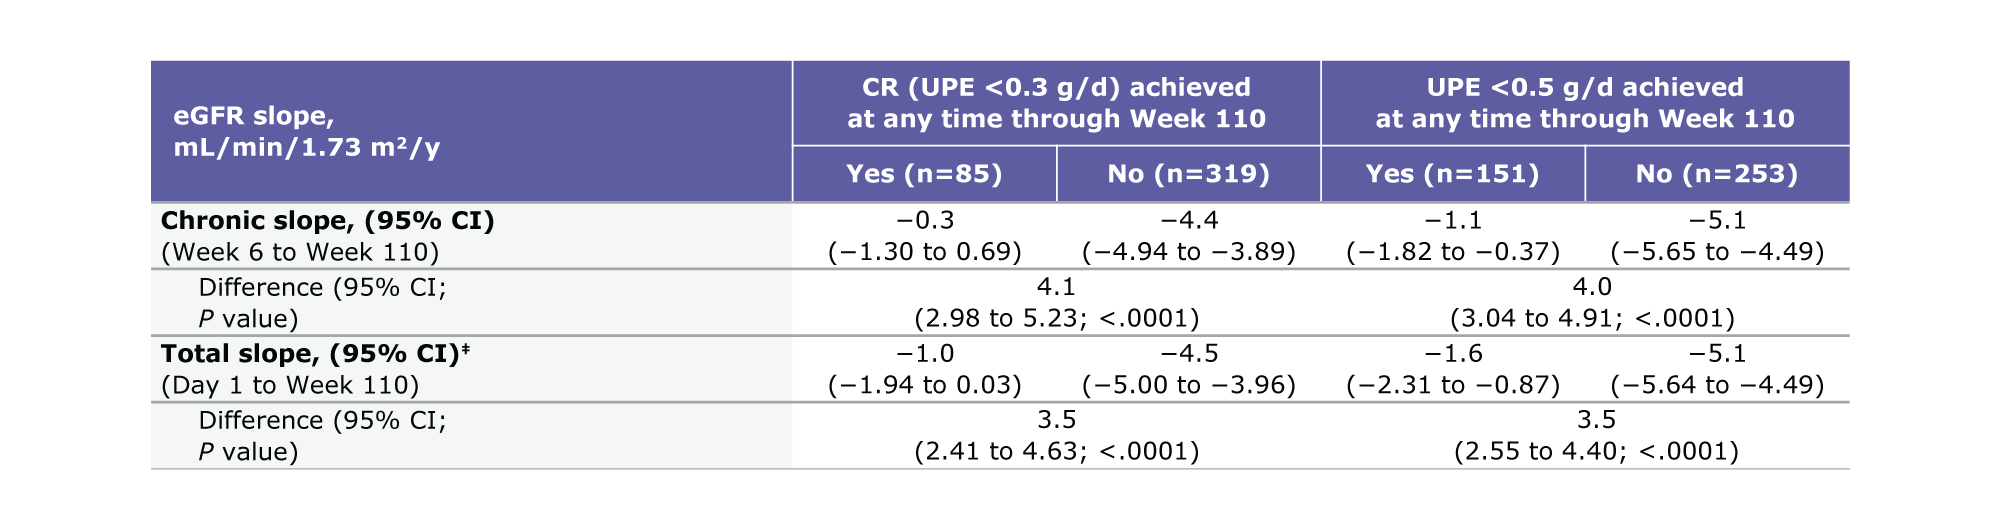
Table. Total and chronic eGFR slopes from any time through Week 110b,c
Patients achieving CR experienced a 4.1 difference in chronic slope (95% CI: 2.98 to 5.23, P<0.0001) versus those who did not1
Patients achieving UPE <0.5 g/d experienced a 4.0 difference in chronic slope (95% CI: 3.04 to 4.91, P<0.0001) versus those who did not1
aBaseline (Day 1) eGFR is included as a response variable and covariate.1 bBased on on-study data.1 ceGFR slopes were assessed using linear mixed effects model and adjusted for baseline log transformed UPE.1
Patients achieving CR experienced a 3.5 difference in total slope (95% CI: 2.41 to 4.63, P<0.0001) versus those who did not1
Patients achieving UPE <0.5 g/d experienced a 3.5 difference in total slope (95% CI: 2.55 to 4.40, P<0.0001) versus those who did not1
Markedly fewer patients who achieved CR or UPE g/d reached composite kidney failure (KF)† endpoint1
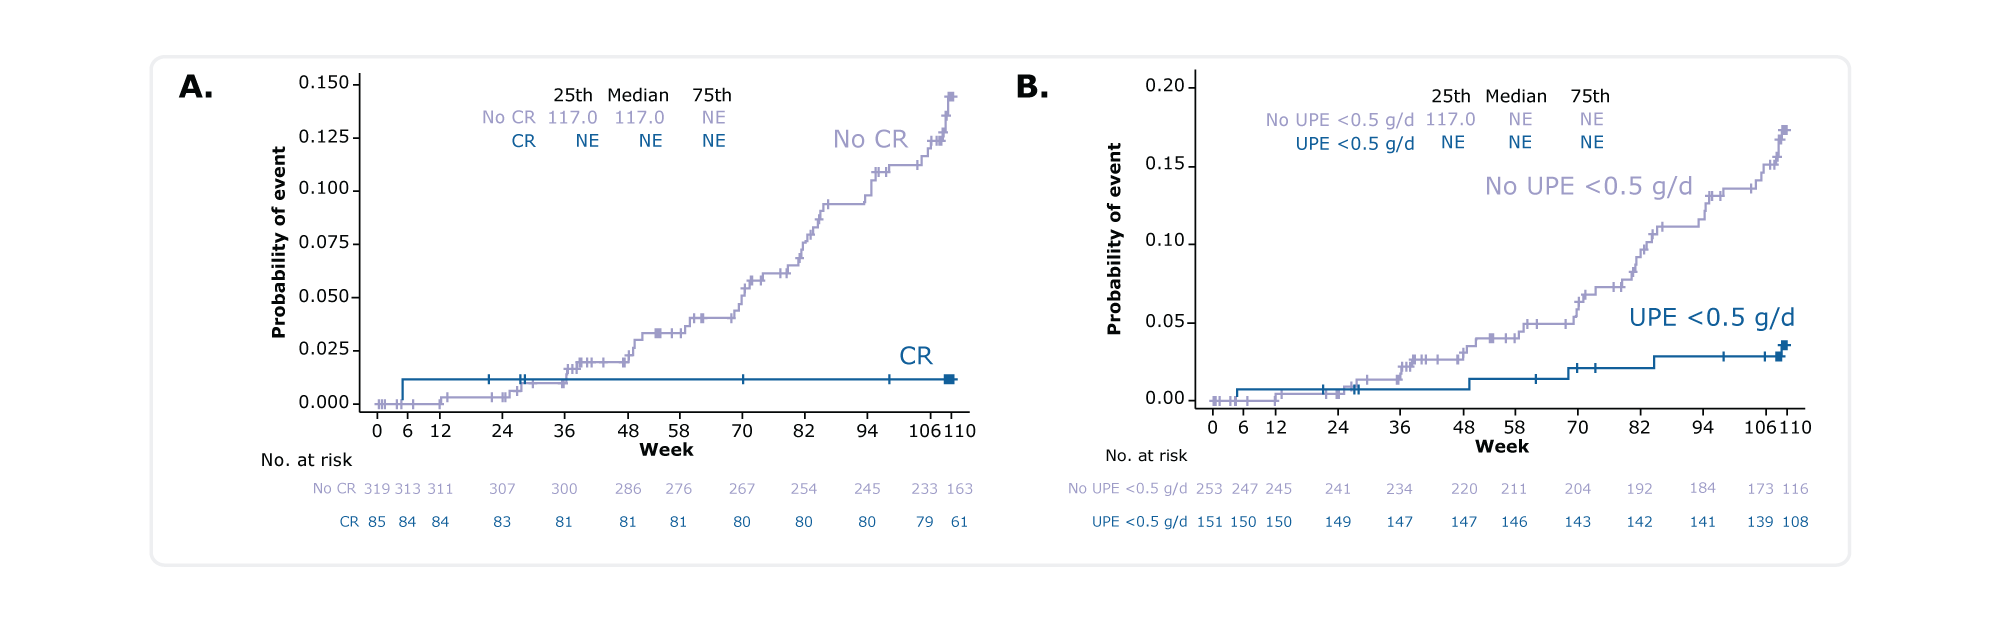
Figure. Kaplan-Meier plot for time to reach the composite KF endpoint in patients who achieved A) CR or B) UPE <0.5 g/d at any time through Week 110
Of patients who achieved CR or UPE <0.5 g/d, 1 (1.2%) and 6 (4.0%) respectively reached the composite KF† endpoint1
Of those who did not achieve CR or UPE <0.5 g/d, 43 (13.5%) and 38 (15.0%) respectively did not achieve the composite KF†
Treatment-emergent adverse events (TEAE) occurred in 79 (93%) patients who achieved CR versus 285 (89%) who did not achieve CR1
The most common TEAEs were:
TEAEs of interest were comparable between groups:
Conclusions
*eGFR chronic slope was measured from Week 6 to Week 110 following the initial acute effect of randomized treatment.4-7 eGFR total slope was measured over the full double-blind study period
(i.e., Day 1 to Week 110).4 †The composite KF endpoint was defined as confirmed 40% eGFR decline, end-stage kidney disease (initiation of renal replacement therapy or sustained eGFR <15 mL/min per 1.73 m2), or mortality due to any cause.1 ‡This study overlapped with the COVID-19 pandemic.
ACEi, angiotensin-converting enzyme inhibitor; ARB, angiotensin receptor blocker; CI, confidence interval; COVID-19, coronavirus disease 2019; CR, complete remission; DEARA, Dual Endothelin Angiotensin Receptor Antagonist; eGFR, estimated glomerular filtration rate; IgA, immunoglobulin A; KF, kidney failure; MMRM, mixed model for repeated measures; SOC, standard of care; TEAE, treatment-emergent adverse event; UPE, urine protein excretion.
MA-SP-24-0138 | October 2024